SPX
This is one of those situations in which the preferred scenario of short and medium term (on hourly chart, bullish from pre-market November 19th) is correct while the very short-term preferred scenario (on 15 minutes chart, slightly bearish) is wrong.
Today I lost a good opportunity for a nice ES intraday trade on the long side, but the important thing is that the main trend remains bullish, because I'm focusing my trading strategy on buy setups to open long positions on leading stocks.
Yesterday a blog's reader asked me: why did you not trade on the long side in the opening session of November 19th when you predicted that 16th had been the end of correction?
Because that was just a hypothesis without confirmation, the trend was still bearish, and because I don't trade with a reversal approach, but on pullbacks and particularly on breakouts.
Now the uptrend resumes, even if is still weak, my preferred scenario of short and medium term remains bullish and I think that the market is in wave [3] of wave a or 1 , but this requires a confirmation from volume and FTD.
As alternate scenario I discarded the old one (because the Alt:4 rises above the bottom of Alt:1 and this is impossible in terms of Elliott wave in impulse patterns) and my new alternate count is an [a]-[b]-[c] , with [c] in progress, of a minute wave of x minor wave.
Yesterday I opened the first long (but small) position in stocks; I purchased MWIV (CANSLIM composite rating 97, interesting flat base pattern with bullish breakout even though volume could be better)
My Stock Watch List for the next week is in "US stocks" page.
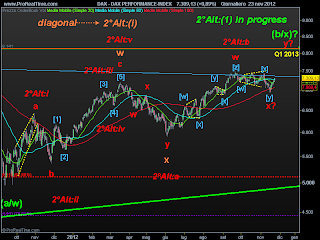
DAX
Preferred scenario:
wave x is ended with a complex [w]-[x]-[y] ( [x] wave like an expanding triangle) and last upward wave y is in progress, to complete the (b/x) wave, then starting a new intermediate bear market cycle.
(see weekly chart on October 27th post for my long-term view)
EUR/USD
Preferred scenario:
EUR / USD has followed the preferred scenario posted 15 days ago, and started the third wave c
(see weekly chart on October 27th post for my long-term view)
Have a great weekend!
ElwaveSurfer


No comments:
Post a Comment
Note: Only a member of this blog may post a comment.